Interactive dashboards for market research & reporting
From SPSS, Excel or databases to an interactive dashboard in minutes — via drag & drop, with 50+ chart types and native PowerPoint export. ISO 27001 certified, GDPR-compliant, made in Munich.
DataLion is a web-based dashboard and market research platform, made in Munich. Drag & drop builds interactive dashboards with 50+ chart types from SPSS, Excel or database data. Export reports natively to PowerPoint, Excel and PDF. ISO 27001-certified, GDPR-compliant, with new features every two weeks.
- 🇩🇪 Made in Munich
- GDPR-compliant
- DPA included
- Hosted in Germany
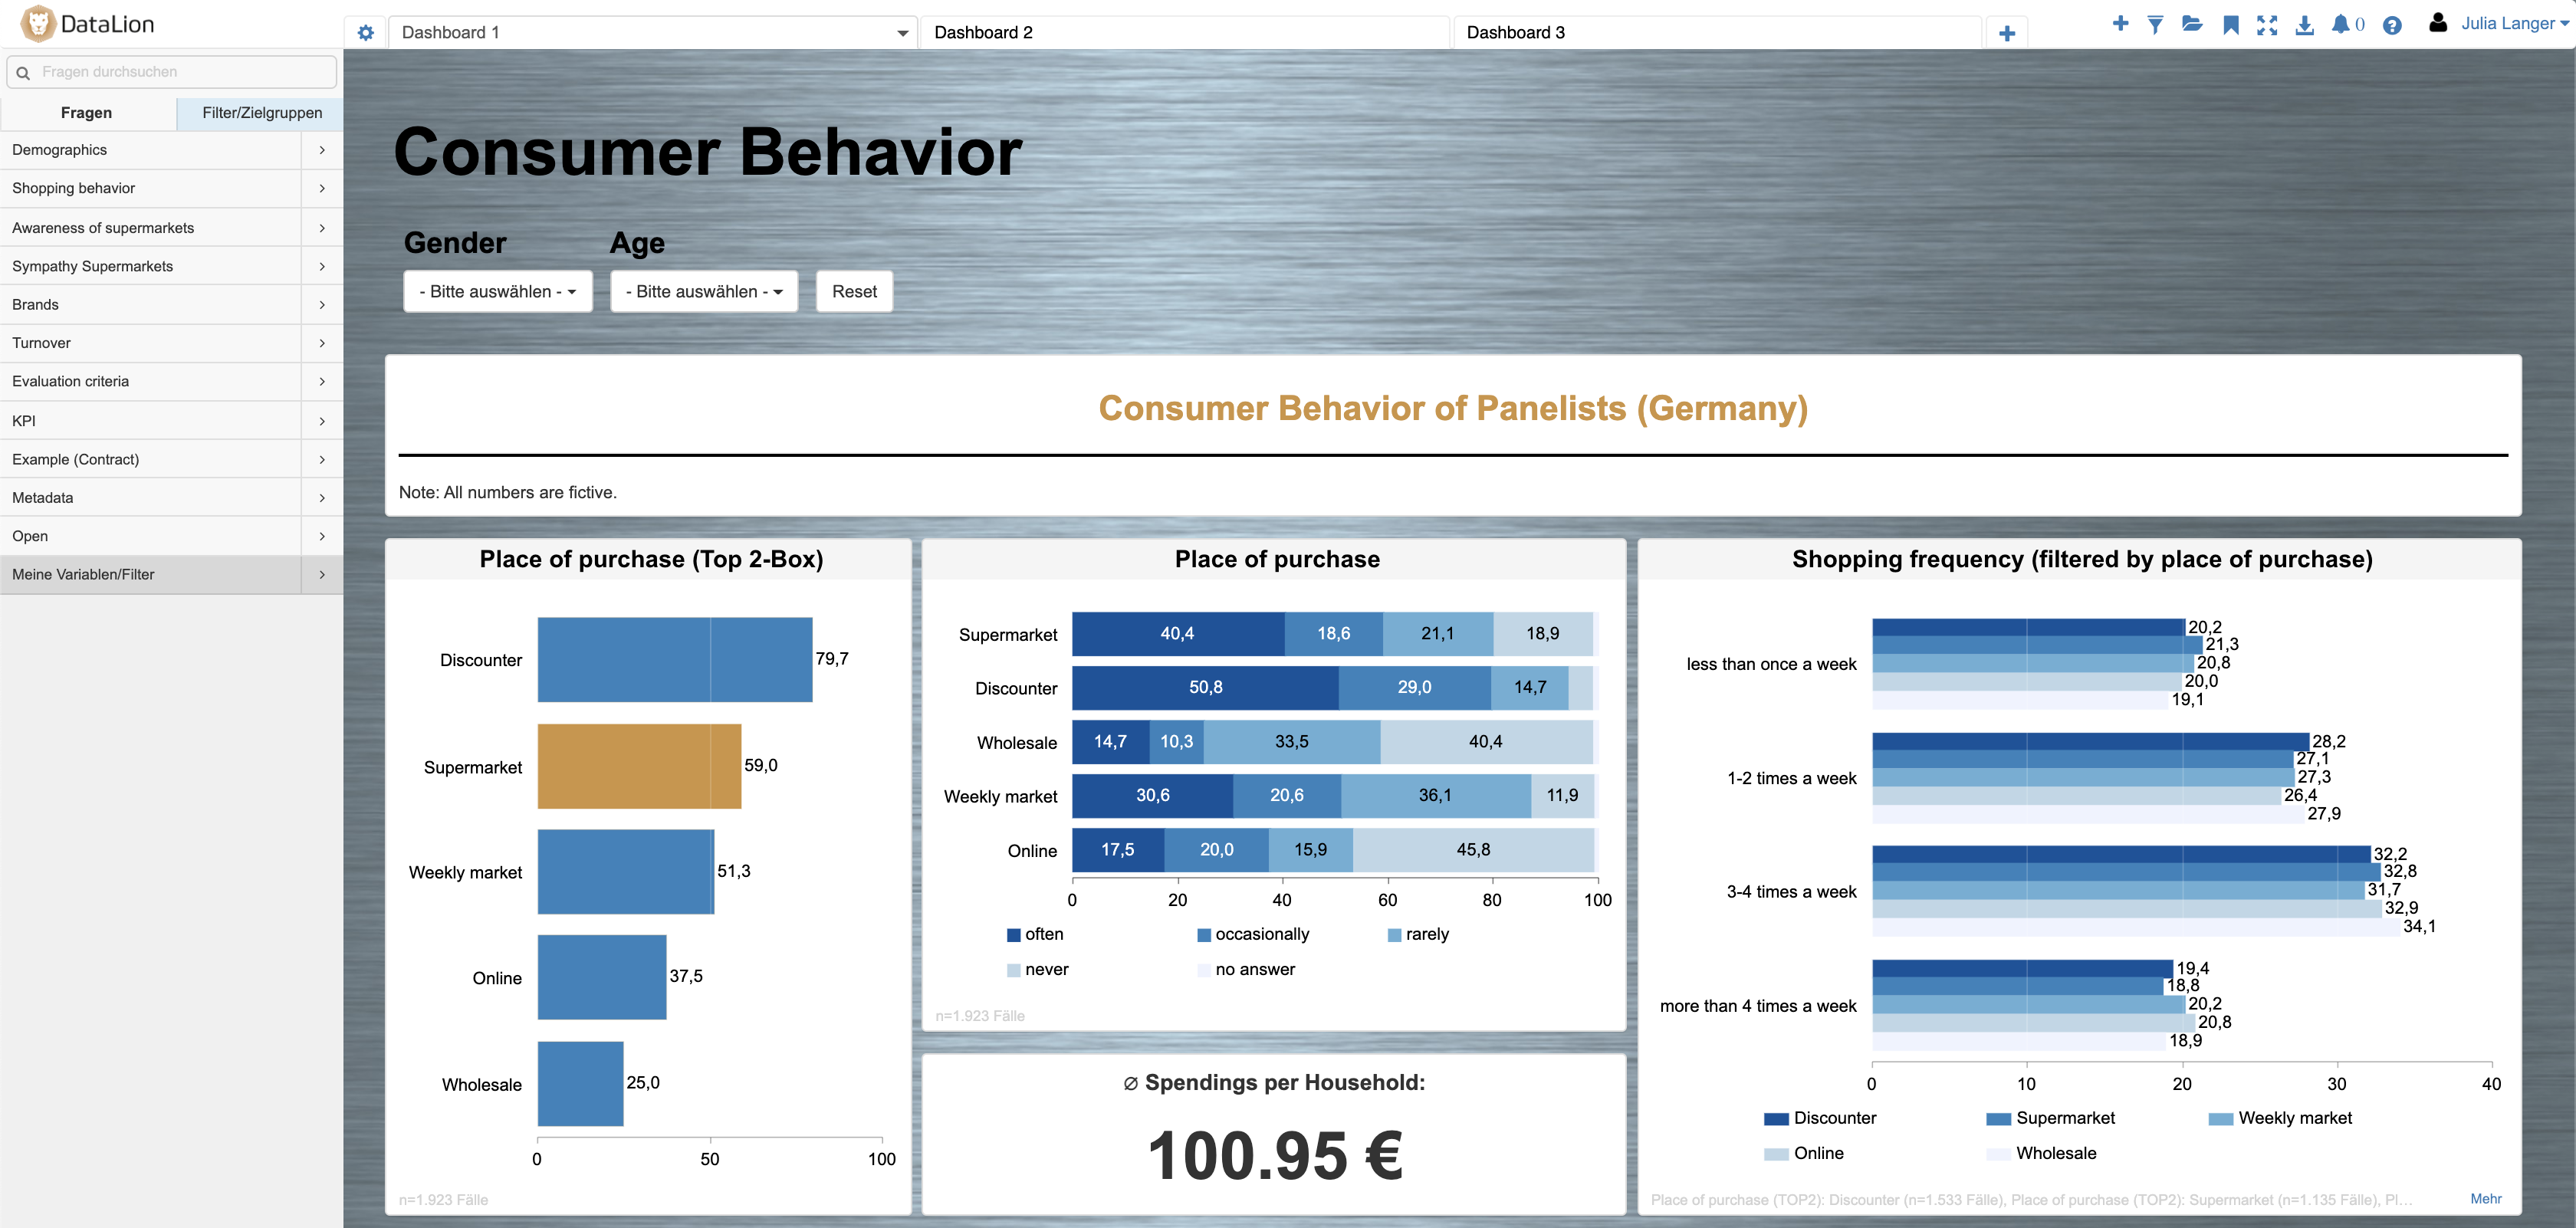
Interactive dashboards — with no code
Assemble complete dashboards with drag & drop — from a customer-satisfaction survey to a media-usage analysis. No IT, no programming.
Your users filter live, drill down into the detail and compare waves across flexible time series — all in the browser.
- Dashboards by drag & drop, not programming
- Interactive filters & drill-downs in real time
- Flexible time series for tracking studies
- For tracking, ad-hoc and panel data
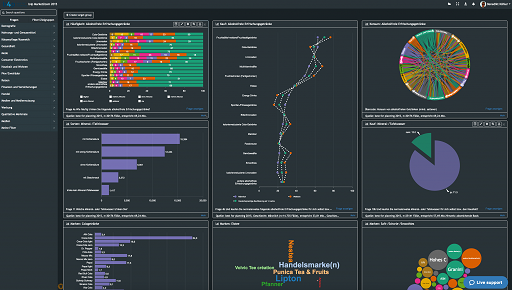
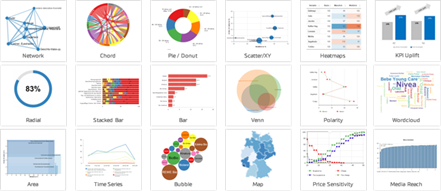
50+ interactive chart types
From bars, lines and donut to network, chord and heatmap charts, word clouds and maps: DataLion offers more than 50 chart types for every question.
Demanding research visualizations such as MaxDiff, conjoint and price sensitivity are built in too.
- Standard charts: bar, line, pie, stacked
- Special: network, chord, heatmap, word cloud
- Maps & geo visualization
- MaxDiff, conjoint & price sensitivity
Weighting, statistics & open-ended responses
DataLion speaks the language of market research: handle weighting, flexible bases, recoding and the analysis of open-ended responses directly in the software.
For deeper insight, advanced methods are ready to go — from regression and driver analysis to ANOVA and significance tests. Learn more on the Data preparation and Analysis & statistics pages.
- Weighting & flexible bases per question
- Recode and compute new variables
- Analyze open-ended responses in a structured way
- Regression, driver analysis, ANOVA, significance tests
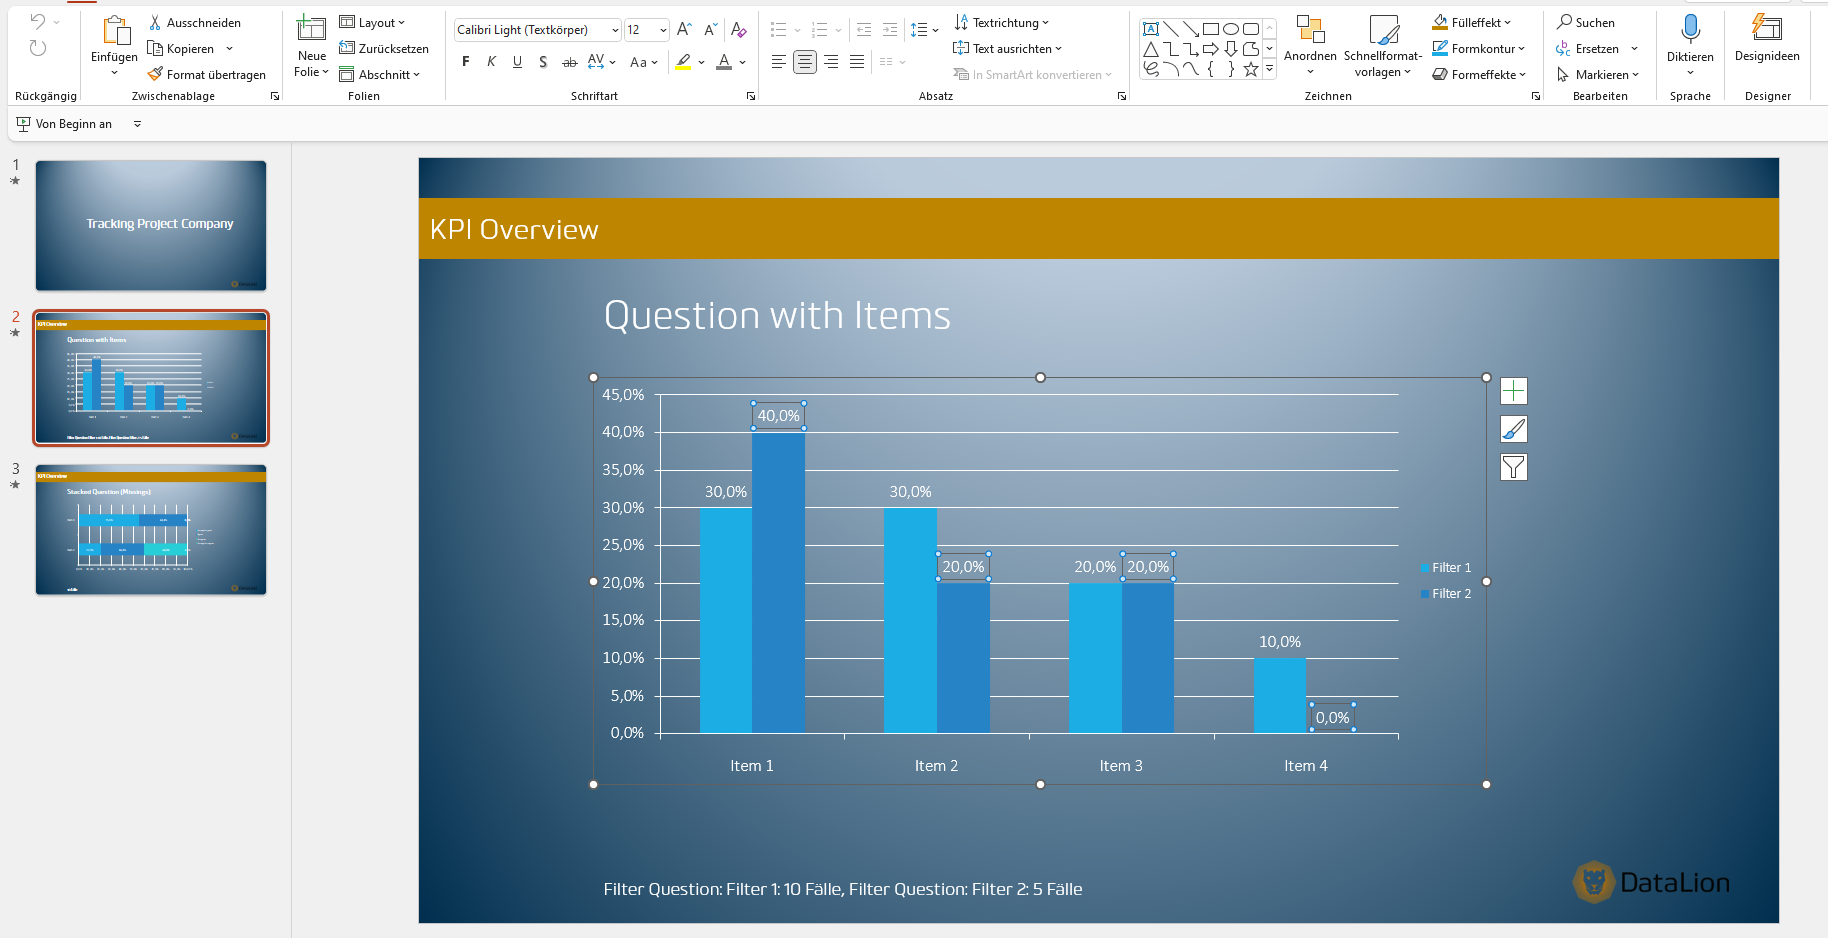
Reports in one click — PowerPoint, Excel, PDF
Export your results as natively editable PowerPoint in your CI layout, as flexible Excel report books, or as PDF — without copy-and-paste.
Once set up, dashboards and reports update automatically — wave after wave.
- Native PowerPoint export in your CI layout
- Flexible Excel report books with your own KPIs
- PDF, CSV, JPEG & embedded website
- Automatically refreshing reports
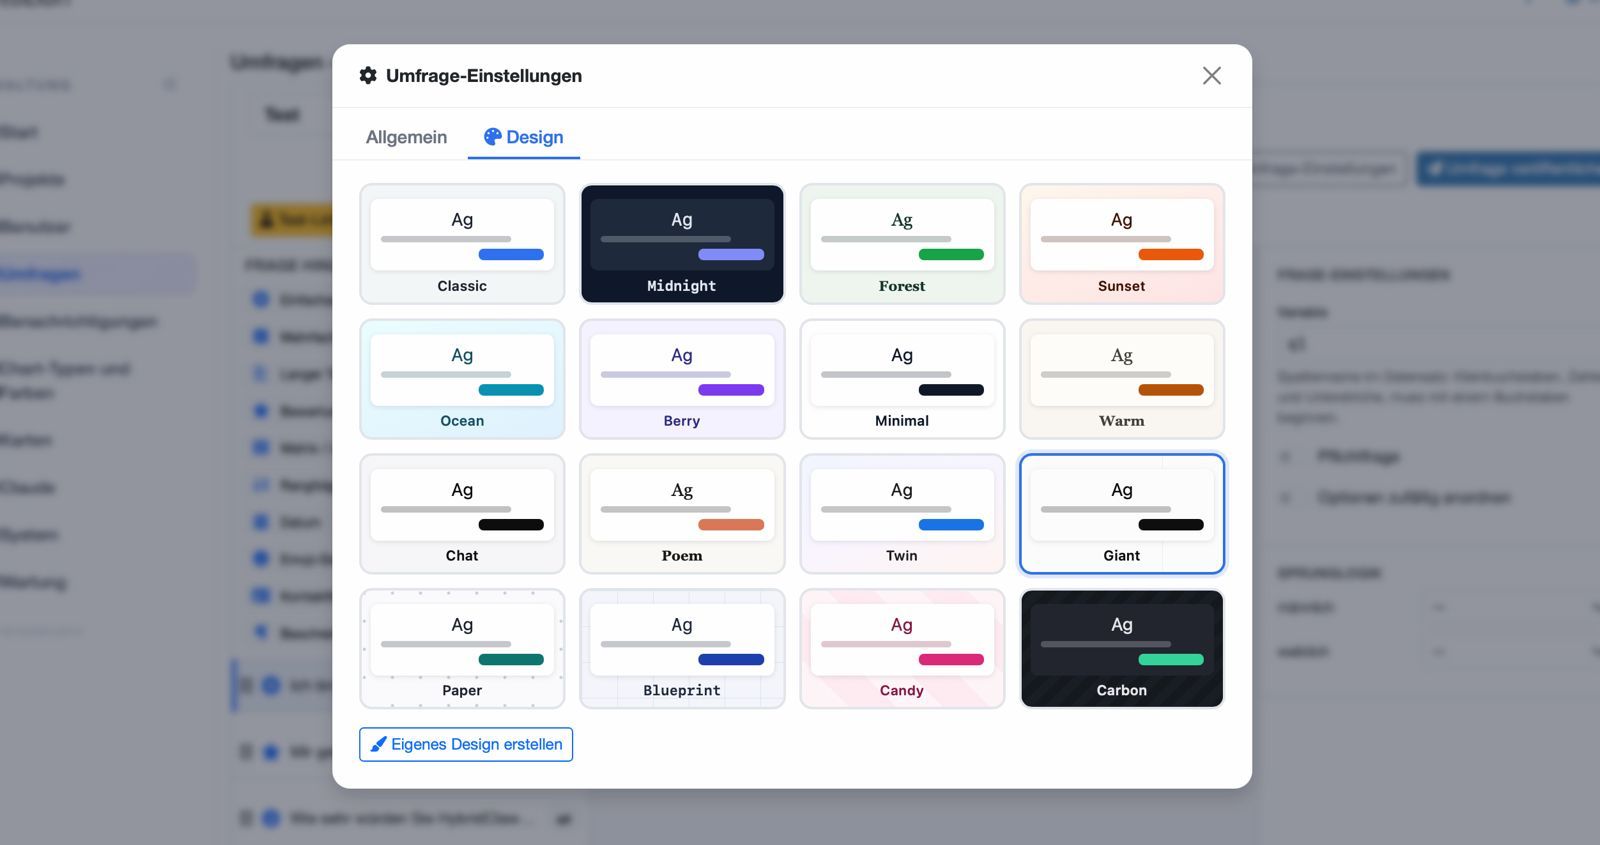
Your look, your rights — multi-client ready
Match dashboards fully to your corporate identity — with ready-made themes, custom colors, CSS and flexible layouts.
Through user management you control rights and roles per team and client — ideal for institutes and multi-client environments.
- Ready-made themes, custom colors, CSS & layouts
- CI-compliant dashboards & reports
- Rights & roles per user
- Multi-client for institutes & enterprises
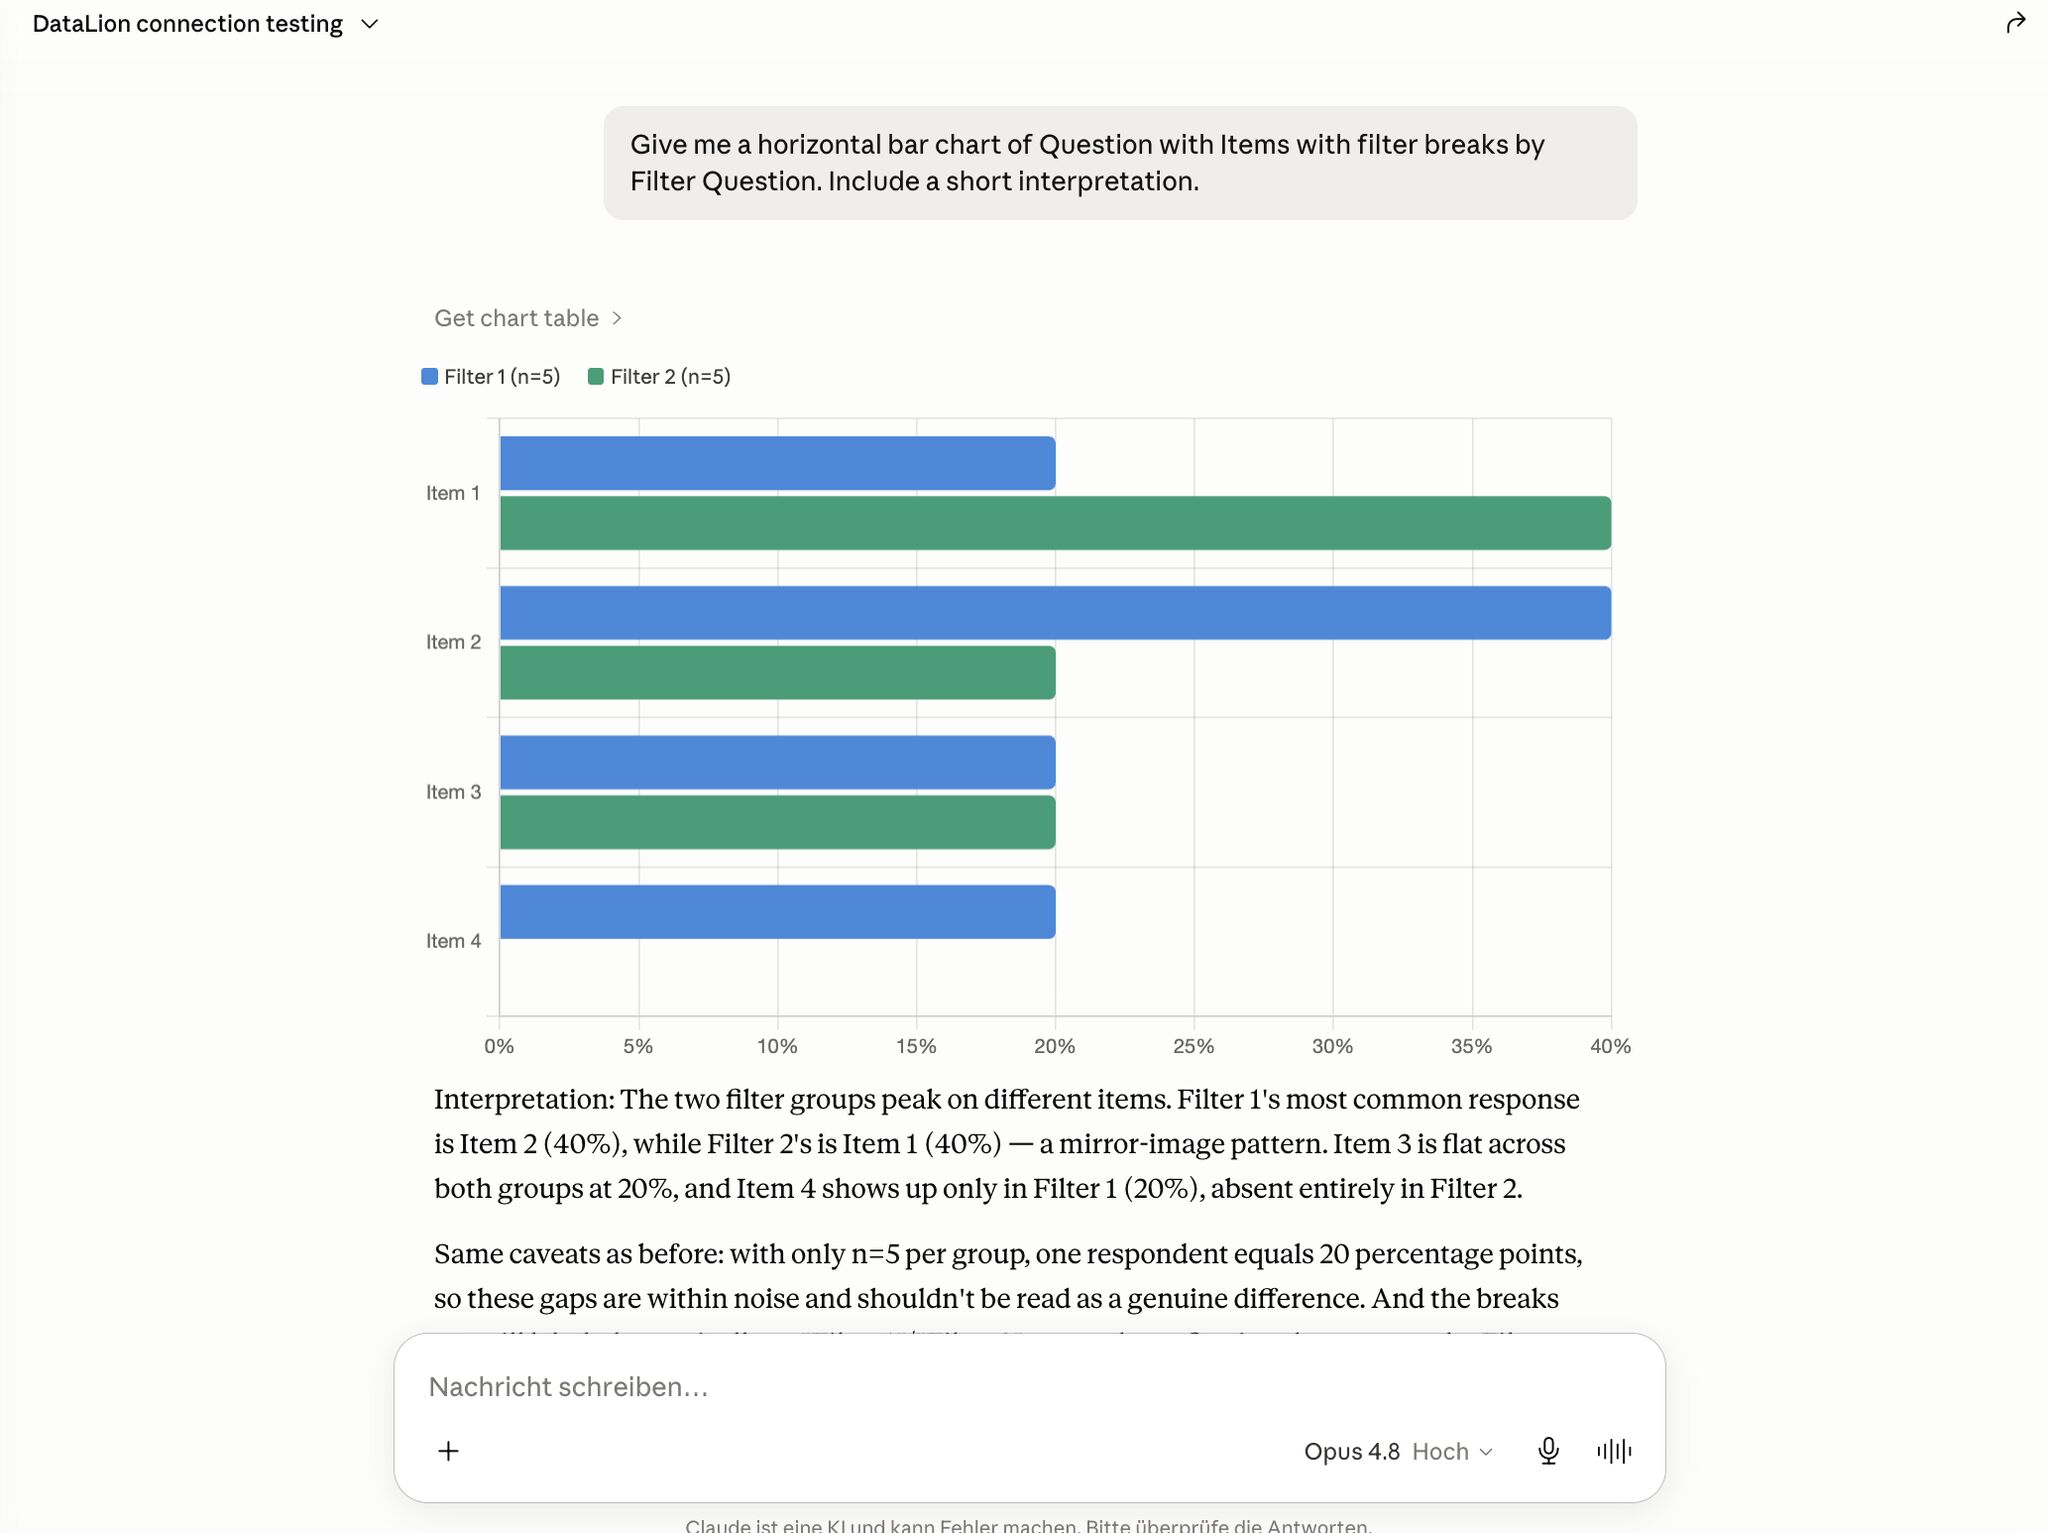
AI agents like Claude drive DataLion
Through the Model Context Protocol (MCP) you connect DataLion to AI agents like Claude — and have them build dashboards, import data and create reports in plain language.
On import, AI-powered data recognition detects structures and metadata automatically. Learn more on the AI market research and data import pages.
- MCP integration for Claude & other AI agents
- AI data recognition on import
- Automatic codebook column mapping
Data protection by design
Your sensitive respondent data stays in safe hands — in ISO 27001-certified data centers in Germany, fully GDPR-compliant and with a Data Processing Agreement (DPA).
- ISO 27001-certified data centers in Germany
- 100% GDPR-compliant, DPA included
- On-premise hosting & IP restriction available
- Made in Munich — support in your language
More from DataLion
Common questions about the dashboard software
What is DataLion?
How many chart types does DataLion offer?
Can I export reports to PowerPoint?
Which data can I import?
Do I need technical skills?
How secure is my data?
Ready for smarter dashboards?
Try DataLion free with your own data — or book a personal demo and see the dashboard software live.