
Use case: conjoint & MaxDiff
MaxDiff & conjoint — analyzed on the R engine
DataLion estimates MaxDiff three ways — down to individual-level utilities. Choice-based conjoint runs fully natively: a balanced design, fielding through the survey, estimation on R and a preference-share simulator with willingness-to-pay. ISO 27001-certified hosting, GDPR-compliant, made in Munich.
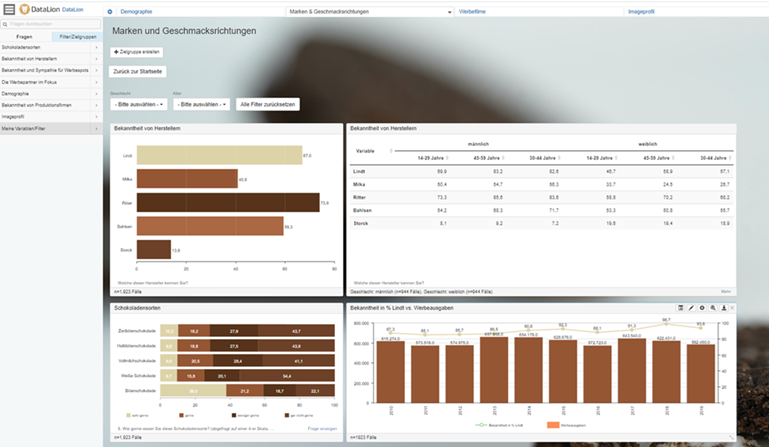
DataLion analyzes MaxDiff directly on the R engine with three estimators: count (best−worst), aggregate logit, and random-parameter logit for individual-level utilities. Choice-based conjoint runs fully natively: a balanced design, fielding through the survey, part-worth estimation (logit/MNL) and a preference-share simulator with willingness-to-pay. Add relative importance, price sensitivity and segment breaks with significance.
- 🇩🇪 Made in Munich
- GDPR-compliant
- DPA included
- Hosted in Germany
- 🌐 Interface in EN, DE, FR & NL
Trusted by research, insights & media teams




- 3 MaxDiff estimators
- best − worst count-based scores
- individual utilities (RP logit)
- 80–99% significance levels
Why choice results often go unused
- The utilities sit in a stats output nobody outside research reads.
- It stops at overall scores — who wants what in which segment is never tested.
- The charts get rebuilt by hand for every presentation.
Three ways to estimate MaxDiff
DataLion estimates MaxDiff on the R engine with three methods: count (best−worst subtraction: times chosen "most" minus "least"), aggregate logit for robust overall scores, and random-parameter logit for individual-level utilities per respondent.
That puts features, messages or claims into a clear, forced rank order — without the "everything is important" problem of rating scales.
- Count: best−worst scores by subtraction
- Aggregate logit: robust overall importances
- Random-parameter logit: individual-level utilities
- Forced trade-offs instead of "all important"
Conjoint, natively: design, field, estimate, simulate
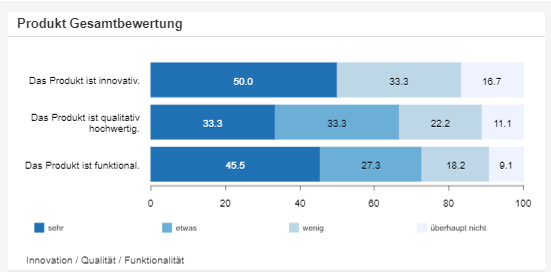
Choice-based conjoint runs fully natively in DataLion — no detour through a second tool. You define the attributes and levels, DataLion builds a balanced choice design, fields the choice tasks through the native survey, and estimates the part-worth utilities on the R engine (logit/MNL).
In the preference-share simulator you then pit products against each other and read off the preference shares; when a price attribute is present, DataLion outputs the willingness-to-pay. Results compare by segment.
- Balanced choice design from attributes and levels
- Field the choice tasks through the native survey
- Part-worth estimation on R (logit/MNL, no HB)
- Preference-share simulator with preference shares & willingness-to-pay
Utilities by segment — tested
Break importances and utilities down by audience with subcolumns and nested tables — and test differences between segments right in the table (80–99%, z/chi²/t).
So you see not just the overall ranking, but which feature truly matters for which segment.
- Importances by segment via subcolumns
- Significance at 80/90/95/99%
- z, chi² and t-test, pairwise and complement
- Nested tables for multi-dimensional views
Results stakeholders can explore themselves
Instead of a static results table, stakeholders get an interactive dashboard where they filter live by segment and compare importances and utilities themselves.
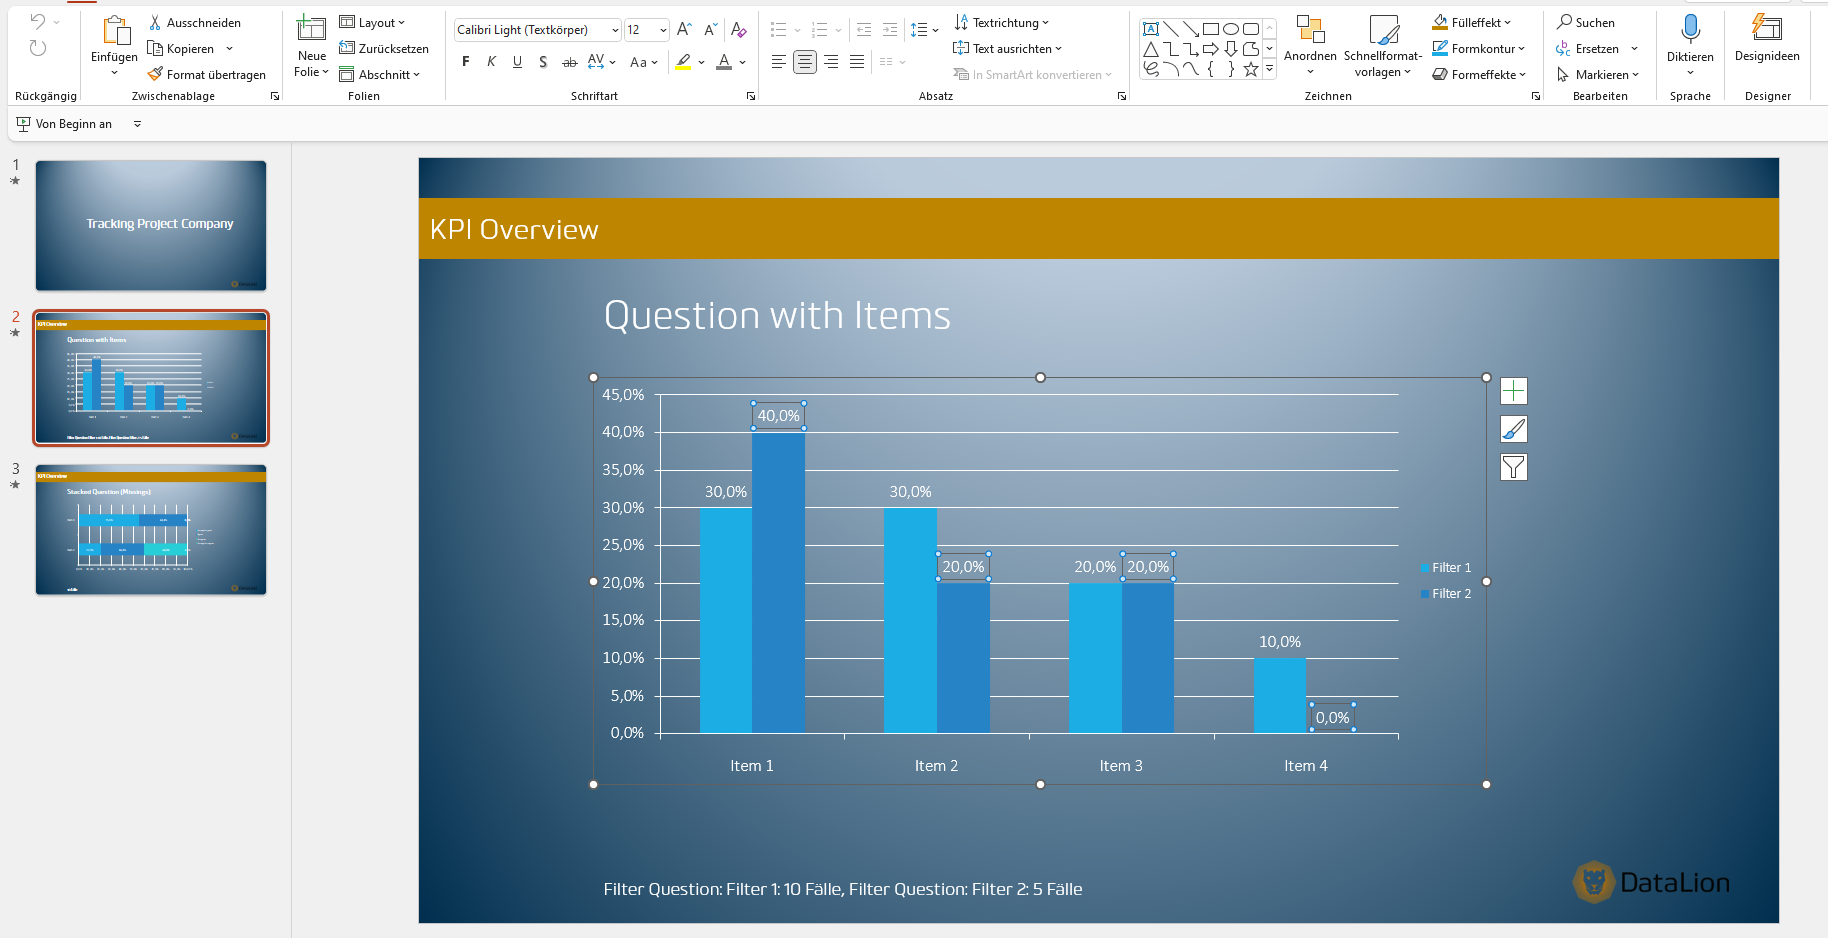
For the presentation, export natively to PowerPoint, Excel or PDF — the analysis stays the same, only the format changes.
- Interactive dashboard instead of a static table
- Filter live by segment
- Native export to PowerPoint, Excel and PDF
- Share by link or embed
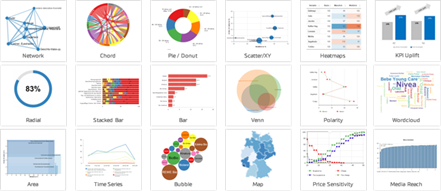
What you can build with DataLion
See DataLion with your own data
Start a free trial or book a personal demo — from raw data to a finished dashboard.
What users say about DataLion
-
Very professional company, attentive to the customer needs, provider of a great software and service.
Generoso M. CRM Analyst · Automotive via G2 -
The contacts at DataLion are very committed. If you have problems, you can count on help. DataLion reacts quickly to requests for new functions.
Robert Q. Managing Director via G2 -
User-friendliness, especially for market research topics. Structured backend with many customization options.
Verified user Market Research via G2 -
The embedding function allows us to generate insights of our data for our audience and customers by far less than half of the usual time needed before.
Verified user Leisure, Travel & Tourism via G2

We now work much more efficiently, giving us more time to take care of the derivations and insights from the data for the customers.
The platform in detail
Go deeper
Common questions about MaxDiff & conjoint
Which MaxDiff methods does DataLion compute?
Does DataLion run conjoint models too?
Do I get individual-level utilities?
Can I test importances by segment?
How do I show price sensitivity?
Ready to analyze your choice data?
Try DataLion free with your MaxDiff or conjoint data — from estimation to an interactive dashboard. Or book a personal demo.